In a nifty contribution to our understanding of LGBT politics, Gallup has surveyed more than 200,000 Americans to ask if they identify as LGBT or not. This gives us what Gallup claims and I’ll accept as the first state-level estimate of this dataset.
But Gallup mistakenly interprets their own findings (or, rather, do not fully extract as much information as they could). Gallup writes
While the variation in LGBT identification across states is relatively small, findings do suggest some evidence that the variation is not entirely random. Social climates that promote acceptance of or stigma toward LGBT individuals could affect how many adults disclose an LGBT identity. LGBT people who live in places where they feel accepted may be more likely than those who live in places where they feel stigmatized to reveal their sexual orientation or gender identity to a survey interviewer.
This map, which I made in R (hence the bizarre boundaries for Michigan, which are the official jurisdictional boundaries if we include the Great Lakes) using code inspired by Jack Santucci, shows a heat map of LGTB identifiers in the USA. I’ve broken the states up by deciles of LGBT identifiers to make the patterns stand out more.
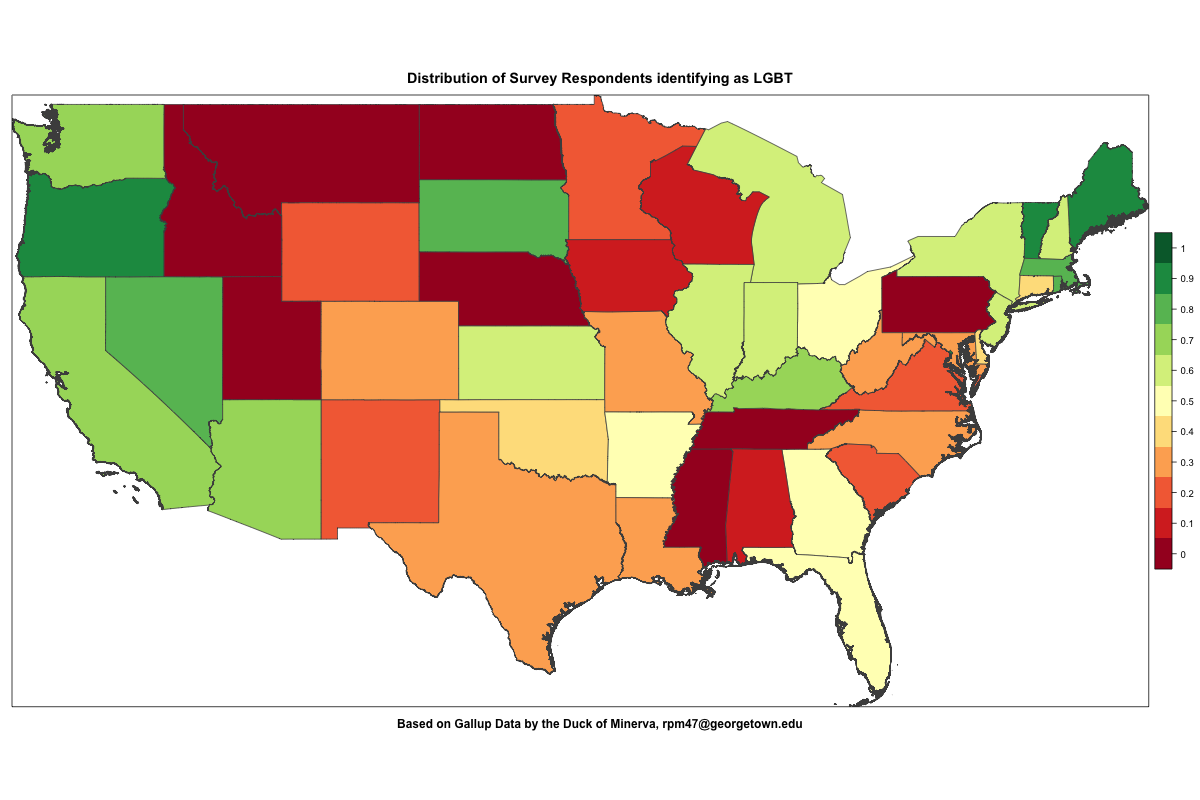
Here, the heat map is scaled so that redder areas have fewer LGBT identifiers and greener areas have more LGBT identifiers. Because these are percentiles, the yellower areas are close to the median of the state-level distribution.
It’s pretty clear from this revised map (as opposed to Gallup’s map on its site) that there’s huge and striking variation among regions in respondents as identifying as LGBT. This may be due to social pressure not to identify as LGBT; it may be due to migration away from gay-hostile areas. But I thought this visualization might help clarify what Gallup has found.
Update At the prodding of commenters, a new map showing the DKNA (don’t know/no answer) percentage implied by Gallup’s reporting of the answers (this series is 100 – Yes LGBT – No LGBT as defined at the Gallup link above).
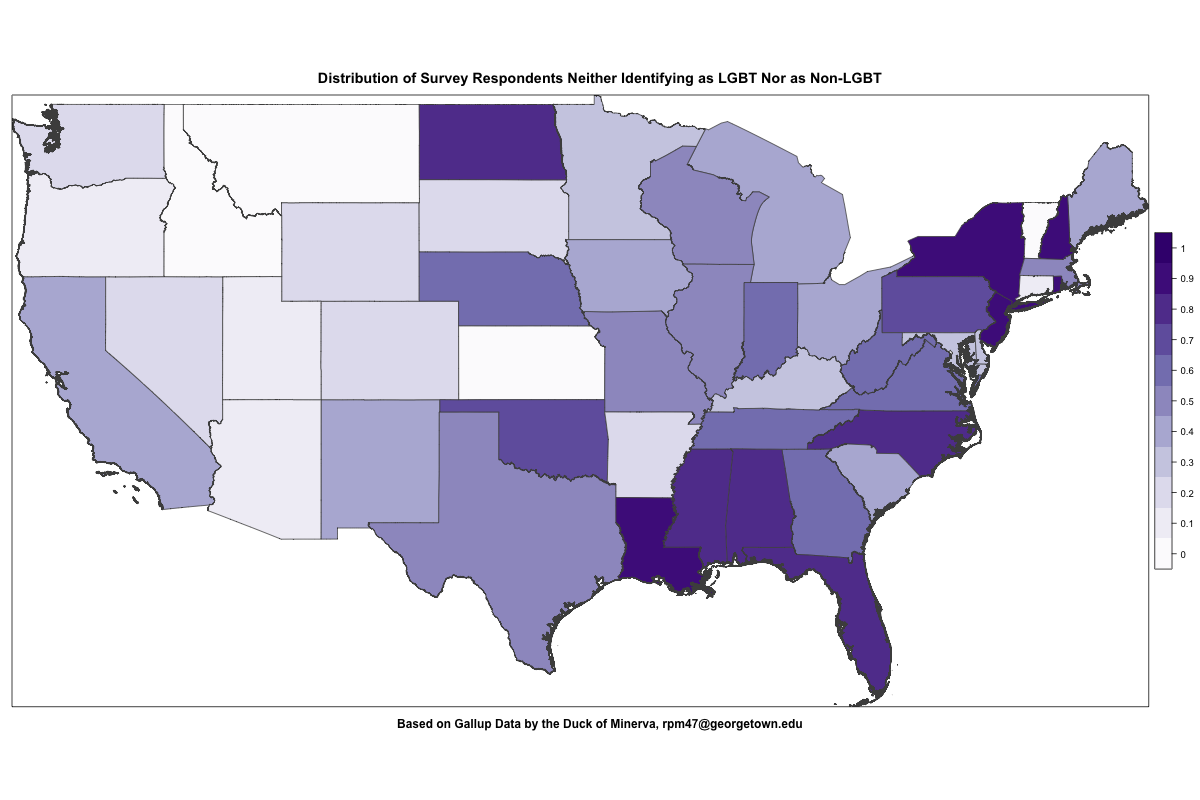
As Micah&Chris points out below, there’s some reason in this data to favor the social-pressure hypothesis. For my part, I do find the fact that both New York and New Jersey show up as high on the DKNA scale as they do a little puzzling but someone who actually knows something about this is likely posting in the comments.

Nice figure, PM. We think that an examination of the “Did Not Answer” percentages supports the “social pressure” explanation and fails to support the “migration” explanation. If LGBT people just moved away from the unfriendly states, then the percentage that refuse to answer this question should be randomly distributed, and uncorrelated with the yes/no percentages. On the other hand, if LGBT people don’t want to identify as such, they can either refuse the question or answer “no;” but those who live in unfriendly states may worry that refusing to answer is tantamount to dancing naked in the Pride parade so they would answer “no,” and at a greater rate than LGBT people living in gay-friendly states. This would cause the “Did Not Answer” percentages to be negatively correlated with the “No” percentages, which is indeed the pattern we find in the scatterplot attached. When we exclude DC as an obvious outlier, the correlation coefficient is a remarkable -0.7342 (p-value < 0.0001). There is no association between the yes percentages and the refusals, but we wouldn't expect to find one in either case. Responses welcomed.
Our scatterplot is here: https://dl.dropbox.com/u/95821/Gallup_DK.png
Hi Micah and Chris, I’m very open to the idea that LGBT identification is caused as much by social pressure as by an underlying spatial hetereogeneity in the distribution of LGBT individuals. (Indeed, I find either the moving-to-cities narrative or the refuse-to-answer narrative plausible, and as I’m sure you’ve noticed, either or both stories are consistent with the data–that is, there could be much less spatial heterogeneity at the state level than at the county level.)
Continuing my response …
My criticism of the Gallup presentation of the data is that they chose to use spatial representations of an absolute measure instead of the relative measure here. That made the regional variations much harder to spot. I should also note that if Gallup has this data available by zip code (or even by area code!) that they can run MUCH finer disaggregations. Indeed, I suspect that more publications will be forthcoming.
The heat map visualizes what variation there is, but that’s not the same as indicating that there is “huge and striking” variation. Except for outlier DC, the range is about 2 to 5 percent, and the IQR is 2.9 to 3.9 percent. That’s not what I call “huge.” What variation there is seems really interesting, and you depict it better than Gallup does. I like the direction ‘Micah & Chris’ are going in.
Fair! “Huge” is too much but “striking” seems fair even on reconsideration. As I try to make clearer below, my interest here was in presenting the one form of variation–regional–that the Gallup visualization doesn’t do well.
Maybe. But the heat map will tend to exaggerate the variation, especially as you have scaled it. So everything is striking.
Of course, if a state’s LGBT-identifying population grew from 2.9% to 3.9%, that would be a not inconsiderable 35% increase. The high DK/NA for states like NY and NJ isn’t inconsistent with the social pressure hypothesis since in those more tolerant states, people who genuinely “don’t know” would feel less pressure to answer “No” dishonestly, and there may also be a boost from gay-tolerant respondents rejecting the question as irrelevant. (LA is high DK/NA as well, but that’s more difficult to parse since it’s a largely conservative state, but has a large, gay and gay-friendly population in NoLa). P.S. I’ve updated the linked scatterplot below to include the (structureless) NA vs. Yes data for comparison.
That’s right. I think the question is whether we regard the difference between 4.9 percent (Oregon) and 2.6 percent (Montana) as substantively interesting. If we do, then rescaling to demonstrate relative shifts is justifiable; if we don’t, then the Gallup presentation should be preferred. Micah’s scatterplot shows a lot of information that neither such visualization demonstrates.
Happy to share my code with whomever asks.
I note that the variance for states excluding DC on the LGBT identification question is 0.50 but on the DK/NA series (which is constructed by subtracting Gallup’s LGBT and Non-LGBT identifiers) the variance is 0.76.